For NDIS providers
See how your supports are really going, before the quarter ends
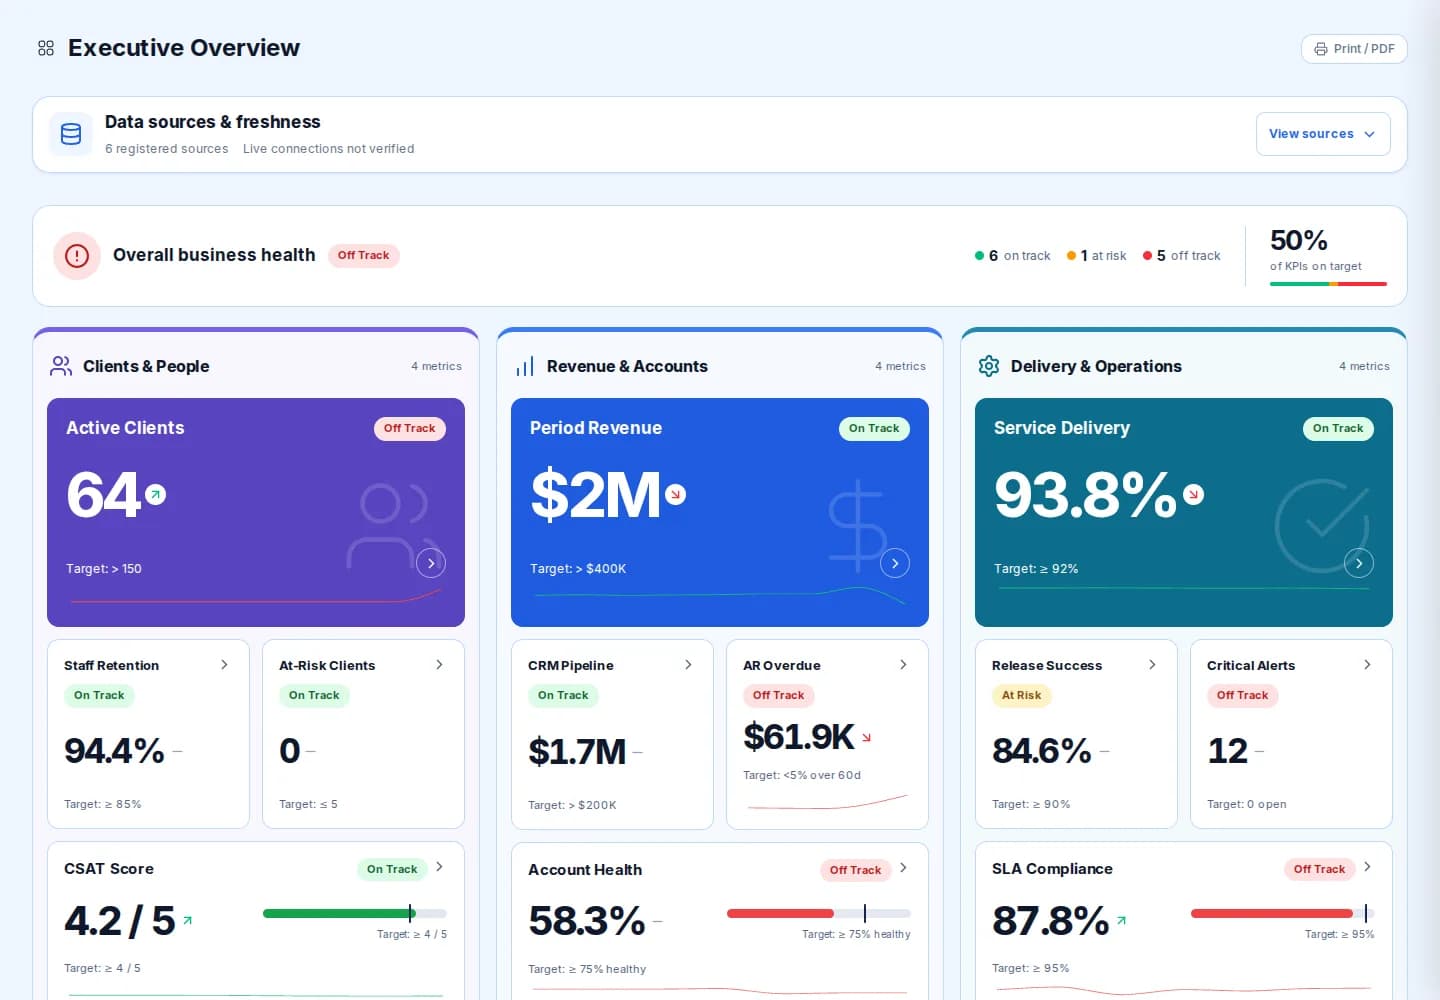
Participants, delivered hours, cancellations, staff retention and the actions people own, on one screen, with a number that says whether each one is on track. Built from the exports you already produce.
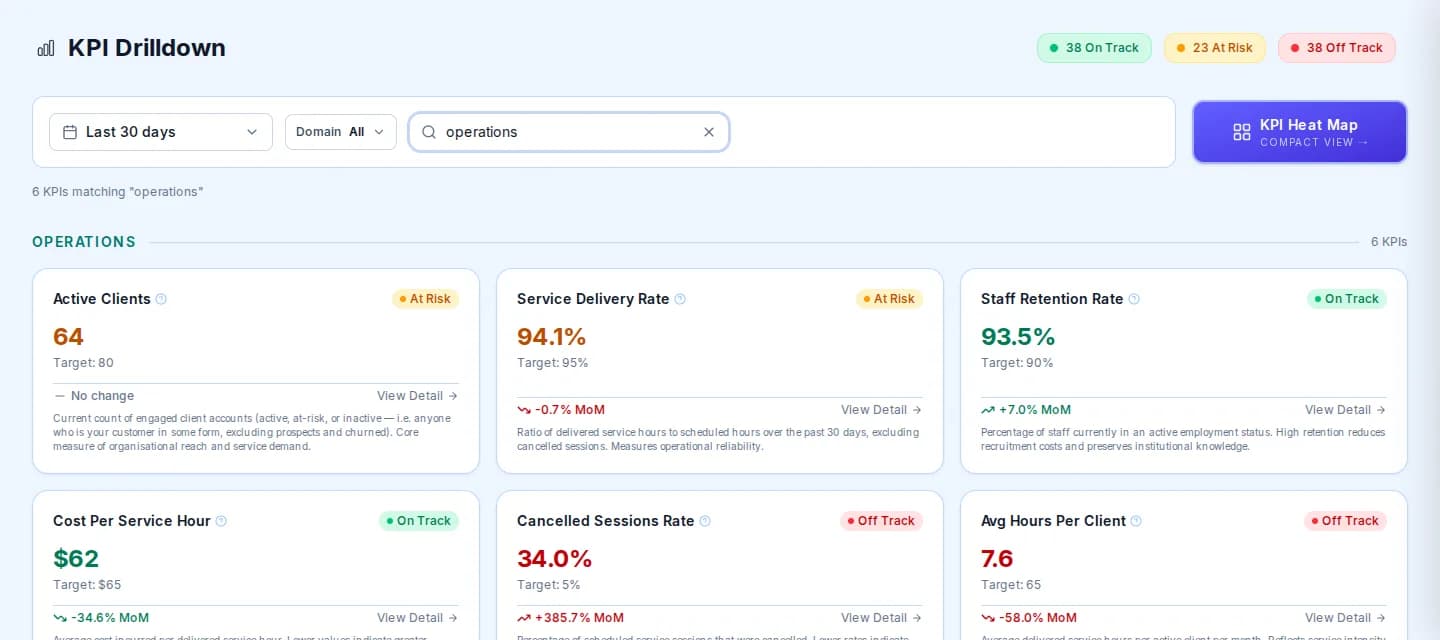
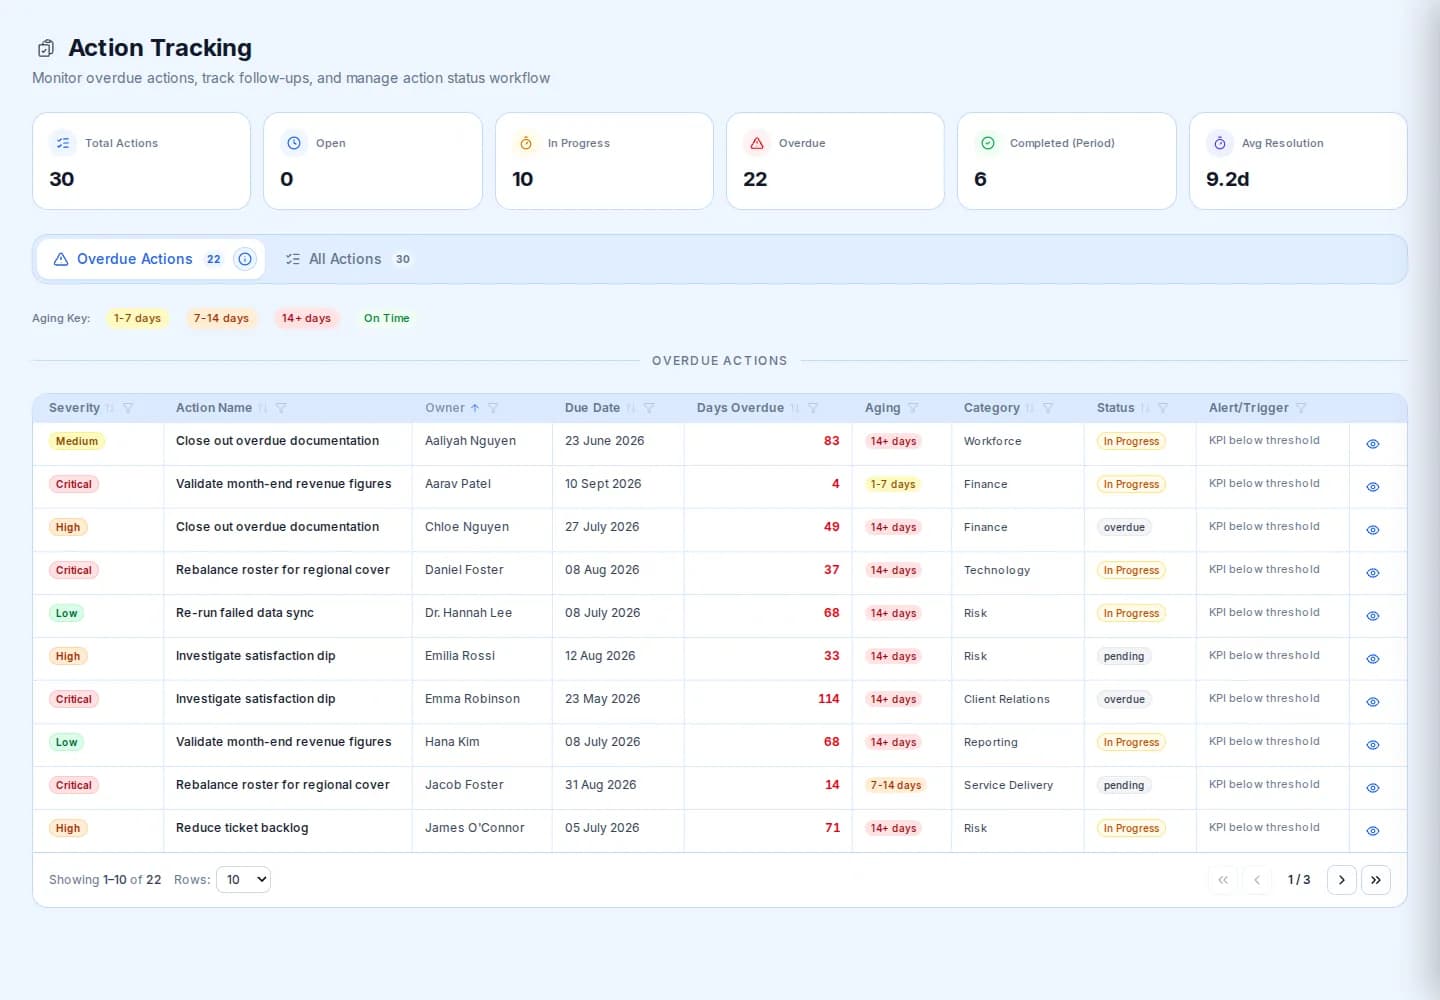
Every picture on this page is our example company, with sample data.
What you see
Participants, delivered hours, cancellations, staff and the actions people own, on one screen.
What you need
The exports you already produce. Nothing new for your staff to type in.
How you start
A 15 minute call, then a working session on one of your exports.
The reason
Why NDIS providers ask for this
Most NDIS providers already have the numbers. They are spread across a client management system, a rostering tool, a finance package and a few spreadsheets, and pulling them together takes a week each quarter. By then the cancelled sessions, the under-delivered plans and the roster gaps are old news.
MERIT Lumina is built around the questions a provider, a plan manager and an auditor actually ask: how many participants are active, what share of scheduled supports was delivered, what got cancelled, what each support hour costs, and who is doing something about the misses. Each measure carries a target, a trend and an owner.
Good to know. Nothing here promises a connection you have to switch on. We load the exports you already have, set the thresholds with you, and the dashboards start from there.
See it working
Three questions, three screens
Pick a question to open the screen that answers it. These are real screens of the platform, filled with sample numbers.
Measures
What NDIS providers watch here
The list is a starting point. We agree yours with you.
Every measure has
- A target
- A trend
- An owner
- Delivery
Active participants
How many people you are supporting right now, against the number you planned for.
- Delivery
Service delivery rate
Delivered hours as a share of scheduled hours, with cancellations shown separately.
- Delivery
Cancelled sessions rate
The share of sessions that did not happen, by team and by month, so the pattern is visible.
- Delivery
Average hours per participant
How much support each participant actually receives, compared with the month before.
- Finance
Cost per service hour
What a delivered hour costs you once travel, cancellations and overheads are counted.
- Workforce
Staff retention
The share of support workers still with you, because participants notice every change of face.
- Accountability
Open exceptions
Every measure that crossed its threshold, with an owner and a due date.
- Accountability
Overdue actions
The actions that were promised and are late, sorted by how late.
How it works
Four plain steps, no new system
Nothing new for your staff to type into.
- 1
Start with the data you already have
Exports and spreadsheets from your client, rostering, finance and HR systems. Nothing new to type in.
- 2
We set it up with you
Together we agree which measures matter, what a good number looks like, and who owns each one.
- 3
Thresholds, owners and exceptions
When a number crosses its line, it becomes an exception with an owner and a due date, not a surprise at the next board meeting.
- 4
Actions and evidence
Every action, status change and sign-off is kept, so the story of what you did about it is there when someone asks.
- Where does the data come from?
- From what you already have: exports and spreadsheets from your client management, rostering, finance and HR systems. We load them with you. There is no self-serve connector to switch on today, and we do not pretend there is.
- Are the pictures on this page real?
- They are real screens of our example company, Merit Lumina (Demo), filled with sample data. Nothing on this page is a client's data. Your version is built from your own exports.
- How do we start?
- With a 15 minute call. Then a working session on one of your exports, so you see your own numbers early and can judge whether it earns its place.
See your own numbers, not ours
Fifteen minutes is enough to decide whether it is worth a working session on one of your exports.